Learning about how a Sensor works in order to extract information from managed devices ( Mac & Windows )
Typically the UEM console does extract a lot of information from the device via the Intelligent hub and showcases this information on the console under the Device list view page . We have seen in the past that multiple customers would use custom attributes in order to extract information but now VMware has introduced a feature called as Sensors which is a way to get hold of device details which is not currently available on the UEM console.
A Sensor is currently supported on MAC and Windows devices and can be used for multiple use cases. The UEM console needs to have WS1 intelligence integrated without which the Sensor configuration page will not function.
So now the question is how do we use a Sensor ? How does Intelligence use a sensor ? What are the benefits of configuring a sensor ?
Lets take a look at an example of how a Sensor can be used to identify if a device is encrypted using a 128 bit bitlocker encryption or a 256 bit encryption .
Step 1 : First we would need to find a script which will work on a Windows device to check if its encrypted with bitlocker using 128 or 256 bits.
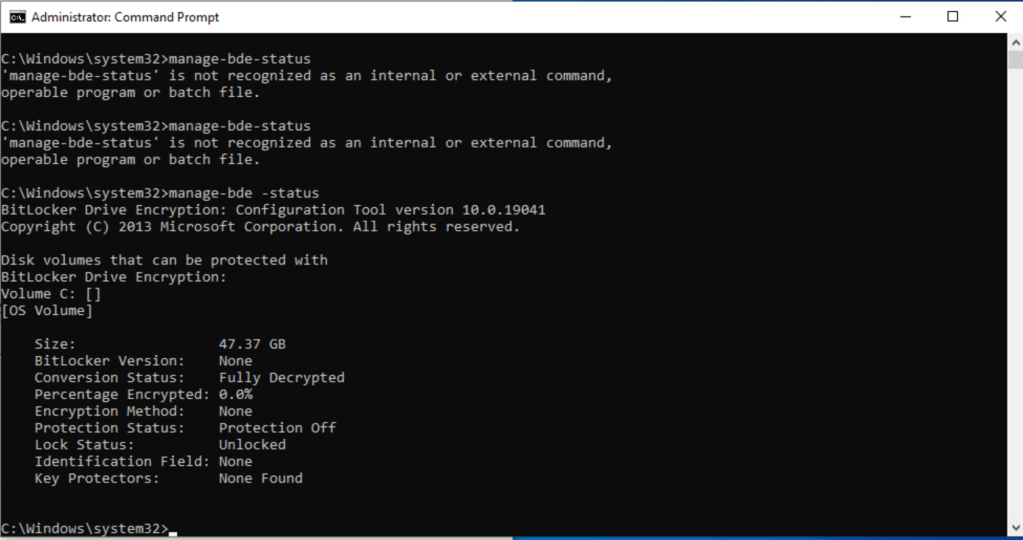
The above is the status of the VM which is currently having no encryption enabled.
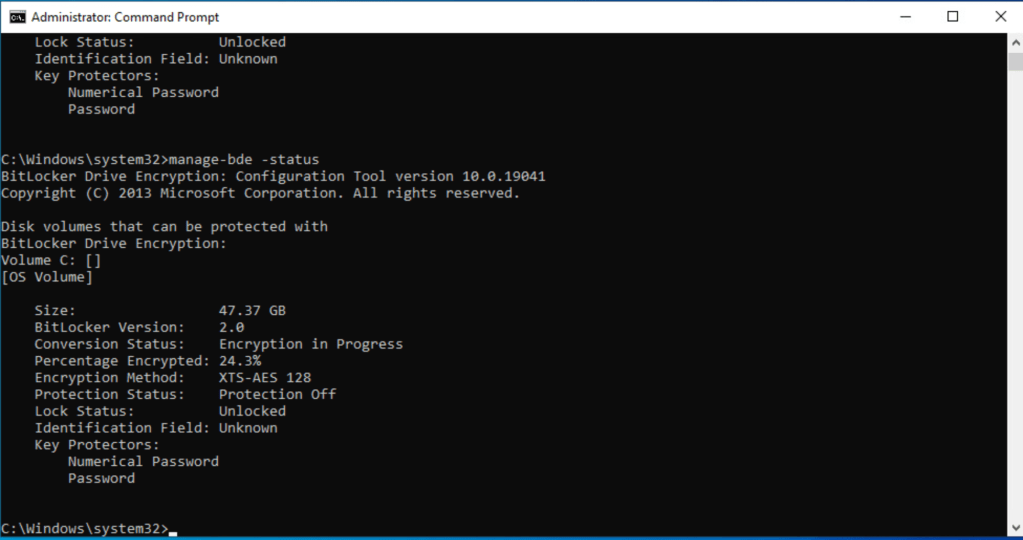
For this test lets enroll a device and then re-rerun the command once.
As we can see now post enrollment the device is getting encrypted using 128 bit encryption.
In most cases organizations have a huge volume of devices and have no way to figure out which devices are 128 bit encrypted or 256 bit encrypted and this can be a huge task for the IT team to identify and then ensure all devices are enabled with 256 bit encryption.
In this particular case we can use a sensor to extract encryption status of all the device and then leverage intelligence to show Sensor output via Dashboard /Report and then use Freestyle orchestrator to enforce device to decrypt and re-encrypt to 256 bit encryption.
Lets look at the steps on how to create a Sensor?
Navigate to Resources–>Sensors–>Add–>Select Platform

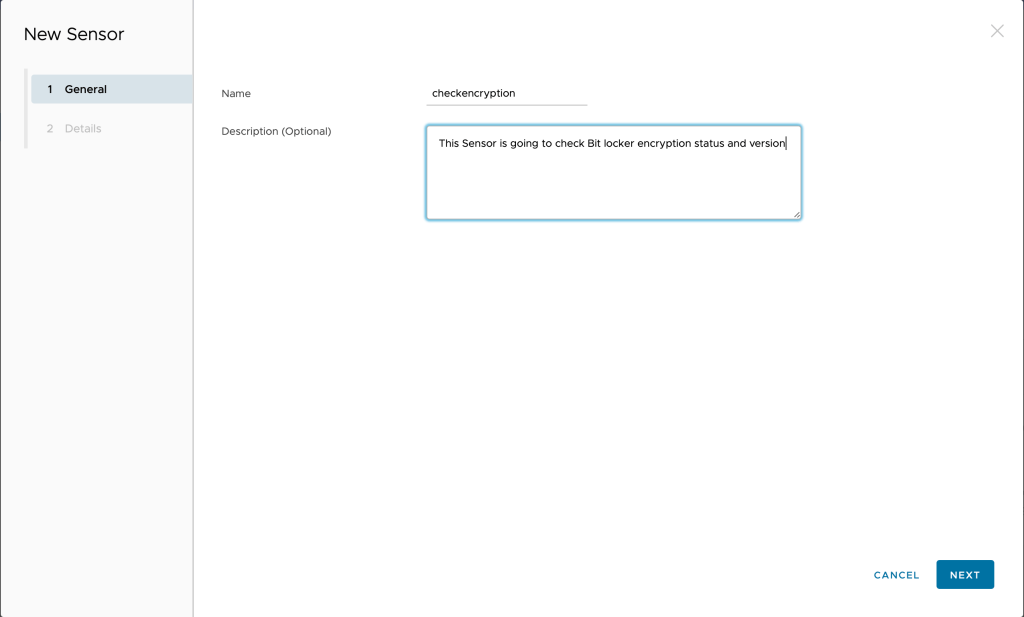
Provide a Sensor name ( use small and not capital letters) and provide a description which is not mandatory but will be useful.
Enter required details for configuration , in this case we have added the following .
Language : PowerShell
Execution Context: System
Execution architecture: Auto
Response data type: String
Code: Type in the code or upload it
The Code/command used here is (Get-BitLockerVolume -MountPoint C).EncryptionMethod

Once completed click on Save & Assign

Click on New Assignment
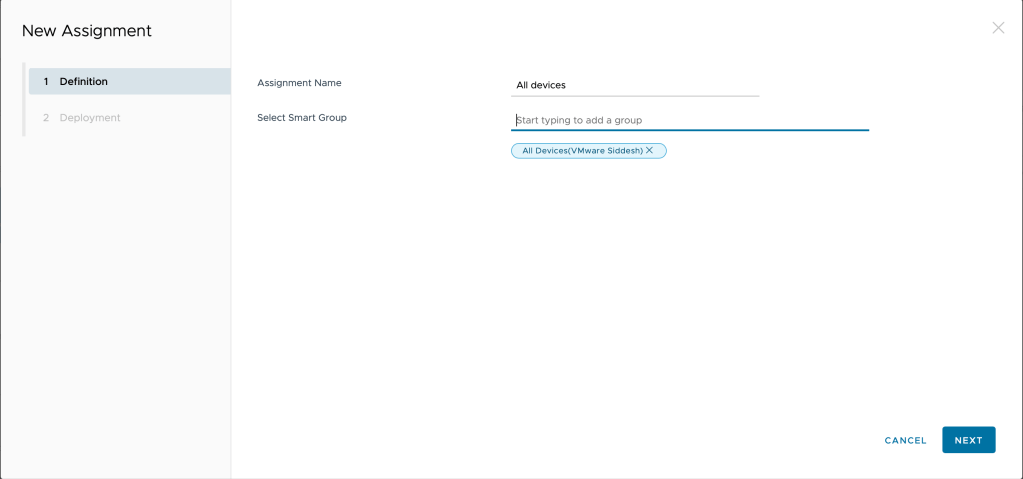
Enter Assignment Name ( add a name of your choice)
Select a smart group which has the devices aligned for this use case
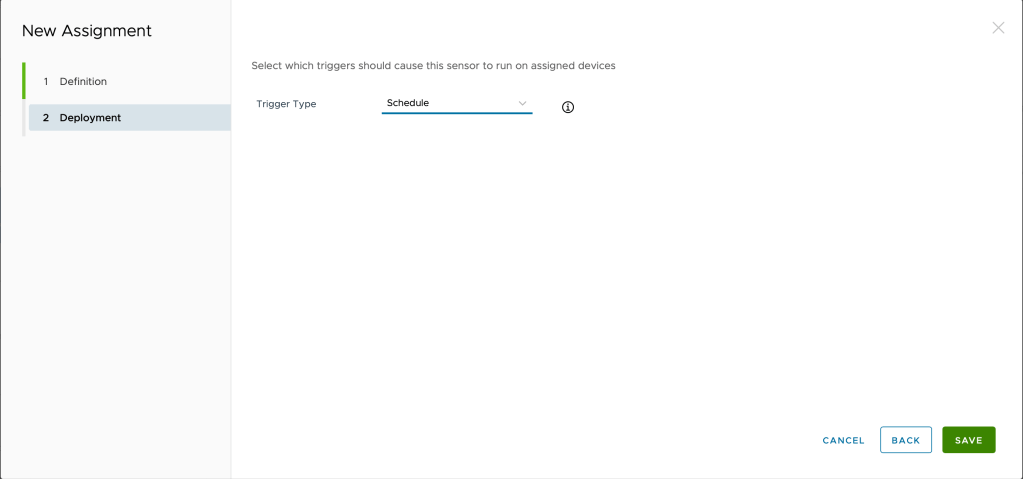
Select deployment method ,
Schedule – To execute on device immediately
Event : If you would like to execute if based on a particular event
Once the Sensor is saved it will be pushed to the device and it might take up to 2-3 minutes for the sensor to execute and show an ouput on the UEM console.
In order to check the Sensor output Navigate to Device –>List View–>Click of Device Friendly Name –>Sensors
You should see an a Sensor value generated , if not then you will have to verify the logs generated to investigate the errors.

For an administrator to check the Sensor values for all devices would be a tedious task to check individually , which is why Intelligence can be used to create a Report/ Dashboard which makes it much easier for an Administrator to track the Sensor outputs.
Steps to Generate a Report for a Sensor :-
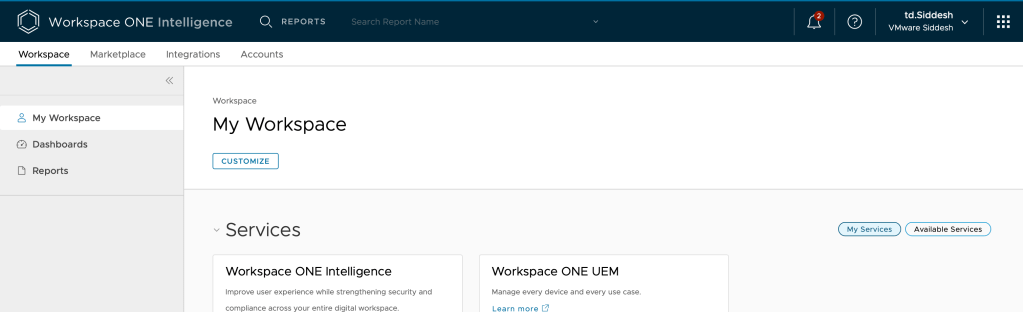
- Navigate to Intelligence console

2. Click on Reports
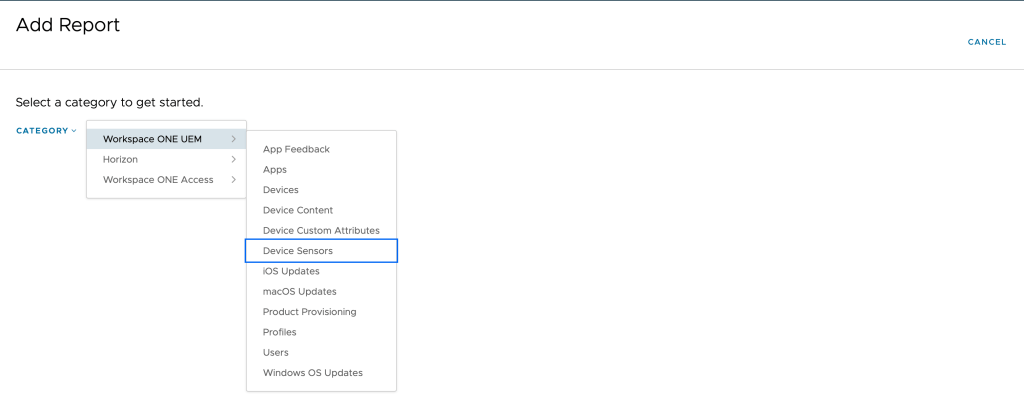
3. Click on Add Report and select Custom Report

4. Select Category–>Workspace ONE UEM–>Device Sensors
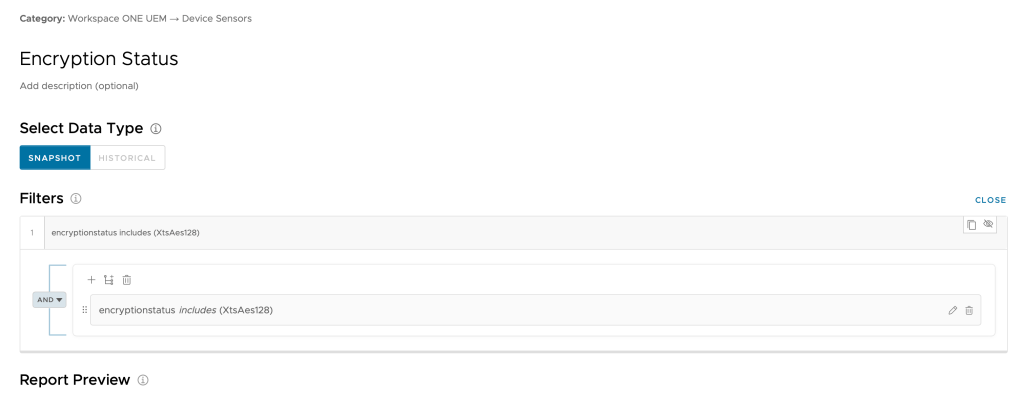
5. Give a Name to your Report , Select the sensor configured and select the operator along with the value.
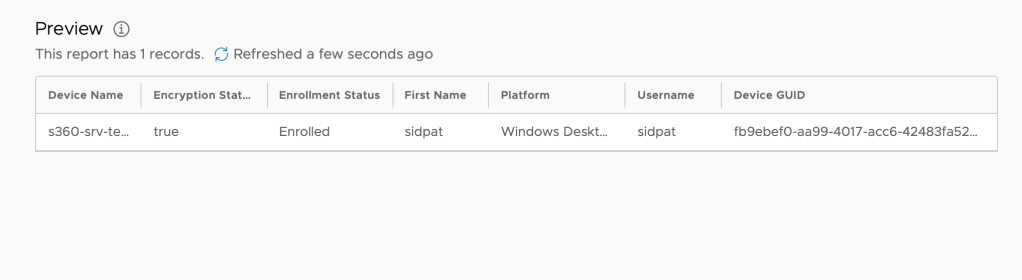
In this example I have selected the following .
Attribute: encryptionstatus
Operator: Includes
Value:XtsAes128
You can preview the report and the save it.
The above steps will help you creating a report for a sensor and share it as well amongs your peers.
Now using the Intelligence Dashboard feature you can view the Sensor output and track the status of your device fleet, in parallel you can use Freestyle orchestrator to tag the devices which are XtsAes128 bit encrypted and based on the tags you can then decrypt the devices using a power-shell script and then re-encrypt them using a UEM bit-locker profile to a 256 bit encryption. ( This is planned for the next blog.. )
The sensors work similar for MAC OS as well and the above example gives a gist on how you can you a sensor to achieve unique use cases .

Leave a comment